
Hero image summary (for your banner copy)
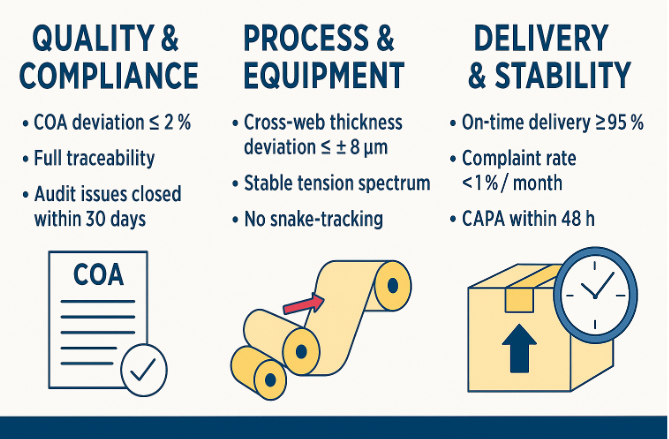
Image 1|Quality & Compliance: COA deviation ≤ 2 %, full traceability, audit issues closed within 30 days
Image 2|Process & Equipment: Cross-web thickness deviation ≤ ± 8 μm, stable tension spectrum, no snake-tracking
Image 3|Delivery & Stability: On-time delivery ≥ 95 %, complaint rate < 1 % / month, CAPA within 48 h
1. The Five Dimensions of a Reliable ODF Supplier
1) Quality System & Compliance
What to look at
GMP / ISO system (not only certificates, but how they’re implemented)
Batch records completeness and traceability
Deviation and CAPA (Corrective and Preventive Action) handling
Evidence you can ask for
Your own re-test vs their COA: deviation ≤ 2 % on key specs
Internal / customer audit findings closed within 30 days
0 recalls in the past 12 months
Red flags
Only sends certificate photos
Refuses to share any past deviation / recall case “even anonymized”
2) Process Capability & Equipment Level
What to look at
Type of coating head (slot-die, comma, micro-gravure, etc.)
Multi-zone drying system and control
Online thickness gauge, web guiding, and tension control
Cleanroom level and environmental control
Evidence you can ask for
Cross-web thickness deviation ≤ ± 8 μm
Batch RSD for thickness / T₉₀ / peel force ≤ 8 %
Drying curve that avoids “skin layer” formation in the last zone
Empty-run tension spectrum that’s stable, edge deviation ≤ ± 0.5 mm
Red flags
Talks only about maximum speed of the line
Never shows process windows, only “best case” samples
3) R&D and Technical Support
What to look at
Ability to co-optimize formulation and process (not just “follow your SOP”)
Capacity for accelerated stability and scale-up trials
Technical team that actually understands ODF, not just tablets
Evidence you can ask for
Data for contact angle, surface tension, and viscosity ranges they can handle
Accelerated stability at 40 °C / 75 % RH for 30 days with no critical drift in appearance / T₉₀ / peel force
Concrete temporary control + CAPA proposal within 48 h when an issue appears
Red flags
Only marketing decks, no raw data, no reports
Vague answers like “Don’t worry, we always do it like this”
4) Delivery Stability & Supply Chain
What to look at
Capacity vs existing load
Backup plans for key raw materials and spare parts
How they handle unexpected outages
Evidence you can ask for
On-time delivery (OTD) ≥ 95 % over the last year
Downtime recovery usually ≤ 24 h for critical issues
At least 2 qualified suppliers for each key raw material
Red flags
Blames “upstream suppliers” for delays
No clear alternative sourcing or contingency plan
5) Business Terms & Risk Control
What to look at
Quality warranty, complaint and claim process
Milestone vs lump-sum payment structure
How disputes and inspections are handled
Evidence you can ask for
Defined response time for rework / replacement (e.g. 5–10 business days)
Regular quality review meetings with a clear target (e.g. complaint rate < 1 % / month)
Red flags
Only negotiates price
Rejects any clause about quality guarantees, audits, or data transparency
2. Verifiable Evidence You Should Always Ask For
Duplicate testing
Request two sets of retain samples from the same batch and test them in your own lab for thickness, T₉₀, and peel force.
Aim for ≤ 2 % deviation vs their COA.Pilot to scale-up path
Do not rely on a single “golden batch.”
Ask for at least 3 continuous pilot / scale batches with all key specs within your target ranges and RSD ≤ 8 %.Stability data
Check accelerated (30 days) and at least one real-time timepoint.
Focus on whether appearance, T₉₀, and peel force stay within spec.On-site visit
Look at actual X-bar / R charts, tension curves, calibration logs, and CAPA records—not just the workshop floor.Deviation review
Pick one historical deviation and ask them to walk you through:
Root cause → Immediate action → Long-term corrective / preventive measures → Verification.
3. A Simple Case: From “Seems Good” to “Consistently Good”
V1 – The first impression
Samples looked good visually, but our own tests showed:
Cross-web thickness deviation ± 12–15 μm
T₉₀ median 78 s
Bag opening time > 3 s
Supplier emphasized their line speed and “big clients,” but had no long-term data curve.
Intervention
Co-optimized surface wetting, bringing contact angle down to 30–35°
Switched the final drying zone to a gentle + low-airflow profile
Re-tuned guiding and tension PID parameters, and began recording weekly tension spectra
V2 – What “reliable” looked like
Cross-web thickness deviation ≤ ± 8 μm
T₉₀ median 31 s
Bag opening time ≤ 2 s
OTD ≥ 95 %, complaint rate < 1 % / month, CAPA issued within 48 h
Cooperation moved from “trial basis” to annual framework with scheduled quarterly reviews
4. Ten Sharp Questions for the First Call
What were your OTD %, complaint rate, and top 3 defect types in the last 12 months?
Can you share raw COA data and send retain samples for our independent testing?
How do you monitor cross-web thickness, RSD, and peel force over time?
Can we see a typical drying curve and tension spectrum from recent production?
Could you walk us through one real deviation / CAPA case, with root cause and verification?
What are your acceptance criteria when scaling from pilot to mass production?
Do you have multiple qualified suppliers for each key excipient and film?
Are you open to unannounced audits or extra on-site visits?
What are your standard time limits and decision rules for quality disputes and claims?
Would you support a 3-batch parallel trial, with all data shared both ways?
5. Three Quick On-Site Checks Anyone Can Do
30-second water dip test
Put a film into 37 °C water and swirl gently for 30 seconds.
It should be almost fully dispersed; if it curls, clumps, or leaves heavy residue, drying and surface wetting need review.Contact angle spot test
Measure contact angle at three points on the film;
if θ > 40°, their wetting / coating system is not fully under control.Empty-run tension spectrum
Ask them to run the line with no coating, record tension curves for 10 minutes.
Large oscillations usually signal poor PID tuning, roller alignment problems, or mechanical imbalance.
6. FAQ
Q1: Why is re-testing the same batch so important?
A: Re-testing lets you verify whether their lab and yours see the same reality. If your results differ from their COA by more than 2 % on key parameters, either their testing, sampling, or process control is unstable—and that will show up as complaints later.
Q2: What if a supplier has great equipment but weak documentation?
A: Good machines without good records usually mean problems will be discovered only after they reach you. A reliable supplier must be able to show data over time (trends, control charts, deviation logs), not just one-time “perfect” batches.
Q3: How long should it take for a supplier to respond to a quality issue?
A: For serious issues, you should expect a temporary containment plan within 24–48 hours, followed by a full CAPA with root cause and preventive actions in about 5–10 business days. If they only offer apologies and no structured plan, that’s a warning sign.
Q4: How should I balance low price vs. quality when choosing an ODF supplier?
A: Treat price as the last filter, not the first. First, confirm that the supplier consistently meets your minimum data standards—COA re-test deviation ≤ 2 %, cross-web thickness ≤ ± 8 μm, stable T₉₀ and peel force, complaint rate < 1 % / month. Only among suppliers who pass these objective checks does it make sense to compare price. A “cheap but unstable” supplier usually costs far more later in rework, claims, and lost market trust.
7. Closing Note
Don’t just ask “How cheap?” or “How fast?”
Ask: “How stable are your numbers, and how fast can you fix problems?”
Suppliers who can talk openly about their data and past failures are the ones most likely to support you in the long term.